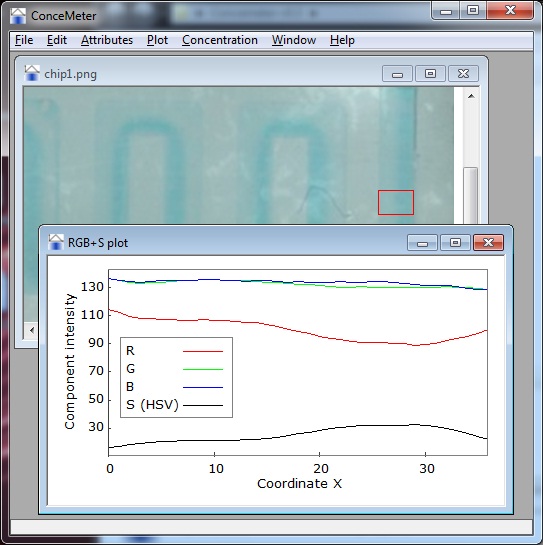
Program for images analysis. It plots RGB and S (from HSV) components for selected image region averaging the vertical lines.
Open any image from menu "Concentration", select area, press P to plot the result or Space to print it. Then you can save plot or export to python matplotlib script for further processing or export as bmp image for presentation.
Repository page with current state of development
Issues tracker